What true fill rate means on Blinkit, how to calculate it, and why the 1P shift changed the metric
True Fill Rate in Blinkit: Formula, Types & 2026 Benchmarks
True Fill Rate in Blinkit: Formula, Types & 2026 Benchmarks
True fill rate in Blinkit is the percentage of units on Blinkit's ORIGINAL purchase order that actually get received at the dark store's GRN. The formula is:
True fill rate = (Units received at GRN ÷ Units on the original PO) × 100
The word "true" matters. Most brands calculate fill rate against their own sales order — the reduced quantity their team accepted — not against what Blinkit originally asked for. That single change of denominator can move the number by 8–10 percentage points. Below you'll find the exact formula, all five fill-rate types in one table, a worked numeric example, real 2026 benchmarks with sources, and why the metric quietly changed meaning when Blinkit went first-party.
What is fill rate on Blinkit?
Fill rate is the share of what a buyer ordered that the supplier actually delivered. In quick commerce, the buyer is the platform (specifically, a named dark store or distribution centre) and the supplier is your brand.
Here's what most 2024-era explanations get wrong. Blinkit is no longer primarily a marketplace where you consign stock onto a virtual shelf. Eternal Ltd's Q3 FY26 Shareholder Letter (January 2026) confirmed the transition to inventory-led retail was "nearly completed in the December quarter, with nearly 90% of NOV" running on Blinkit's own inventory. Eternal's Q1 FY27 results (reported by Storyboard18, Business Standard and Business Today, 22–24 July 2026) show the same thing in the accounts: Blinkit revenue from operations up 552% year-on-year to ₹15,664 Cr on Net Order Value of ₹17,132 Cr — a revenue-to-NOV ratio only possible under gross 1P revenue recognition.
Translation for a seller: Blinkit now buys your stock against a purchase order. It does not wait for you to keep a shelf stocked. So fill rate on Blinkit is not a "did you stay in stock" availability score any more. It is a wholesale vendor-compliance metric, measured against a PO, the way Amazon Vendor Central measures a supplier. Same word, different meaning, different denominator.
What is the Blinkit fill rate formula, and how do you calculate it?
Take the honest version first — unit (quantity) fill rate against the original PO:
Fill rate % = (Units received at GRN ÷ Units on the original PO) × 100
Now the worked example. This is arithmetic, not an estimate, and it is the fastest way to see where your number leaks.
Blinkit raises a PO for 500 units of one SKU to one dark store.
- Your team sees the PO two hours later. Other channels have drawn down stock in the meantime, so you accept and raise a sales order for 450 units.
- You dispatch 450 units against an ASN.
- At the dark store, 20 units are short-received at GRN — some damaged in transit, some rejected on remaining shelf life. 430 units are recorded as received.
Two very different numbers come out of the same PO:
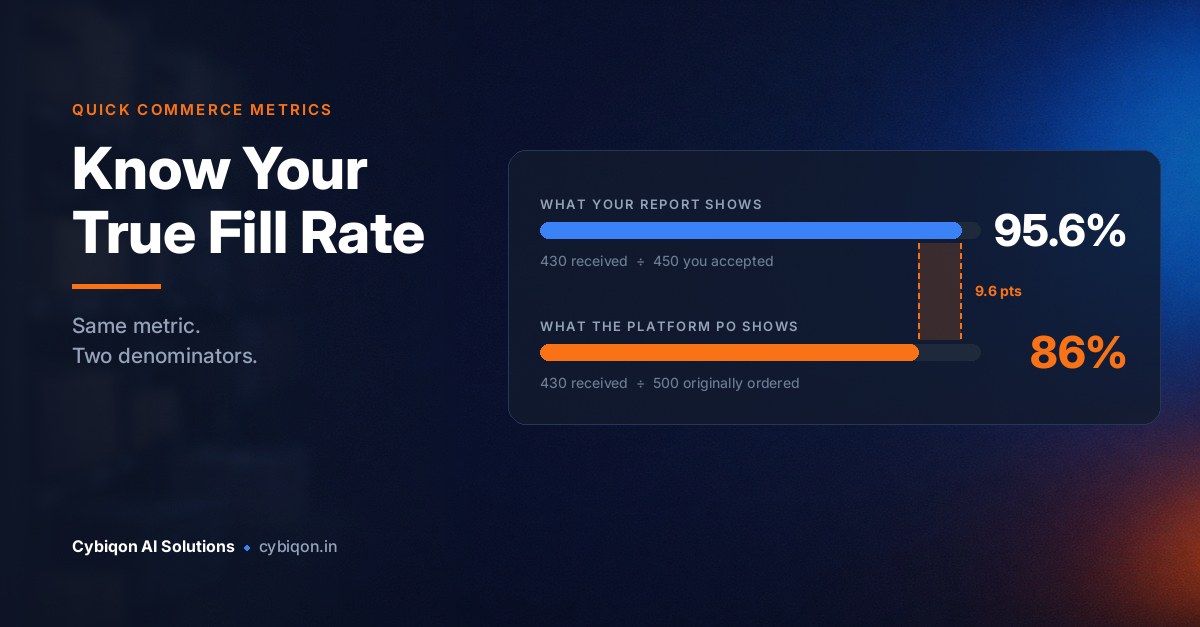
- Your internal report: 430 ÷ 450 = 95.6%. Looks healthy. Gets sent to the founder.
- The true fill rate: 430 ÷ 500 = 86%.
That 9.6-percentage-point gap is the PO-vs-SO gap — and no report built on your own sales order can ever contain it, by construction. The 50 units you never accepted vanished before your spreadsheet started counting.
One more twist: under order fill rate, this same PO scores 0%, because the order was not filled completely. Which is precisely why you must always state which fill rate you are quoting.
What is the difference between PO fill rate and SO fill rate?
- PO fill rate measures delivery against the platform's original purchase order quantity. This is what Blinkit is scoring you on.
- SO fill rate measures delivery against your own sales order — the quantity your team accepted after trimming it to available stock.
SO fill rate is not a lie; it is just a different question. It answers "did we ship what we promised?" PO fill rate answers "did we serve what the customer's buyer actually wanted?" Only the second one predicts whether Blinkit keeps raising POs of that size.
The practical problem is that operators report very short PO acknowledgement and ASN windows — as tight as 60–90 minutes before quantities are auto-reduced. If nobody logs the original PO quantity before it is trimmed, the true number becomes unrecoverable. Log the original PO the moment it lands, even if you do nothing else.
What is the difference between order fill rate, line fill rate, unit fill rate and value fill rate?
These four (plus OTIF) get used interchangeably across seller blogs, which is why two teams can both say "our fill rate is 95%" and mean completely different things. Here is the full set:
| Fill-rate type | Formula | What it measures | Typical behaviour |
|---|---|---|---|
| Unit / quantity fill rate | (Units received at GRN ÷ units on original PO) × 100 | Actual quantity served | The honest "true fill rate in Blinkit" — use this as your default |
| Order fill rate (OFR) | (Orders fulfilled completely ÷ total orders placed) × 100 | All-or-nothing, per PO | Harshest; one short unit zeroes the whole PO, so it drops fast |
| Line fill rate | (Order lines fulfilled in full ÷ total order lines) × 100 | Per-SKU line completeness | The usual middle ground; good for spotting problem SKUs |
| Value fill rate | (₹ value received ÷ ₹ value of original PO) × 100 | Rupee impact, weighted to premium SKUs | Best proxy for revenue impact |
| OTIF (On Time In Full) | ≈ Fill rate × on-time rate | Quantity and appointment adherence | You can hit 96% fill rate and still fail OTIF by missing your slot |
Pick one as your headline metric — unit fill rate against the original PO — and report the others as diagnostics. Mixing them week to week is how a brand convinces itself nothing is wrong.
Is fill rate the same as OTIF?
No. Fill rate asks "how much arrived?" OTIF asks "how much arrived, and did it arrive in the booked appointment window?"
This distinction bites hard in quick commerce because dark-store receiving windows are reported by operators as short as ~30 minutes. A truck that is fully loaded, correctly labelled and 40 minutes late can score 100% on unit fill rate and 0% on OTIF for that PO. If your team is celebrating fill rate while the platform is scoring OTIF, you'll be genuinely confused about why POs are shrinking.
What is a good fill rate on Blinkit, Zepto and Instamart?
Here is the honest answer, and it is deliberately different from what most pages tell you: no quick-commerce platform in India publishes an official fill-rate target, a public threshold, or a documented demotion rule.
What is real:
- 90–95%+ is the widely-reported operator target — the number brand supply-chain teams and their partners work to in practice.
- The benchmark is per store cluster, not national. A mean across dark stores hides cluster-level collapse: if half your stores run at 98% and a handful of new-city stores run in the 60s, your average still reads comfortable while two cities starve. Break the number down by city and by dark store or it will lie to you.
- Fill rate is only meaningful alongside OTIF and value fill rate. Serving 95% of units but missing your top three revenue SKUs is a worse quarter than the headline suggests.
Does Blinkit really demote your listing below 80% fill rate?
You will find this claimed as established fact across dozens of pages: drop below 80% and Blinkit's algorithm demotes your listing. We could not find a single primary source for it — no Blinkit seller documentation, no seller agreement clause, no regulatory filing. Every trail leads back to D2C agency blogs, 3PL and WMS vendor content, and onboarding-service marketing, none of them citing anything.
So we're not going to repeat it.
What brands do consistently observe is more subtle and more dangerous: the platform responds to poor fill rate by quietly reducing PO size and frequency — not by sending you an alert. There is no red banner. There is no email. There is a slow month where the POs are smaller, and your sales team reports it upward as "demand looks soft in Bengaluru."
That is the real cost of not measuring the true fill rate in Blinkit: the feedback arrives weeks late and arrives disguised as a demand problem. By the time you diagnose it as a supply problem, you've lost a quarter of PO volume you have to earn back.
Does fill rate mean the same thing on Blinkit, Zepto and Instamart?
Not any more — and this is changing under your feet right now.
- Blinkit is already inventory-led (1P), so fill rate there is PO-compliance against a purchase order.
- Swiggy Instamart is heading the same way. On 20 August 2026, Outlook Business reported that Swiggy — having secured shareholder approval for Indian-owned-and-controlled status under FDI rules — is preparing to move Instamart to a Blinkit-style inventory-led model worth roughly 80 basis points of contribution margin, over a two-to-four-quarter transition. The ownership restructuring and transfer to Swiggy Instamart Private Limited were corroborated by Storyboard18 and Business Standard.
- Zepto is moving the opposite way. Per Inc42, Zepto has incorporated Zepto Marketplace Pvt Ltd and is restructuring toward a marketplace model ahead of its IPO — which pushes fill rate there back toward an availability metric.
So a brand that built one spreadsheet definition of "fill rate" in 2024 is now measuring three different things with one number. If you're just getting started across these platforms, our guide on how to sell on Blinkit, Zepto and Instamart walks through the onboarding path first — get listed correctly, then instrument the metric.
Scale context, so you know what you're planning against: Blinkit had 2,443 dark stores as of 30 June 2026, up from 1,544 a year earlier, targeting 3,000 by March 2027 with 70–75% of new stores in India's top 10 consumption hubs (Eternal Q1 FY27 results). Swiggy Instamart had 1,171 dark stores across 131 cities as of the same date, adding just 28 in the quarter, with GOV of ₹7,907 Cr (Swiggy Ltd Q1 FY27 results). Zepto reported 1,139 dark stores and 75 warehouses as of 31 March 2026 in its updated DRHP filed 8 June 2026, having added only ~110 stores in FY26 versus 692 in FY25. Across all Indian quick-commerce platforms combined, Redseer counted 6,280 dark stores in January 2026 — that's the industry total, not Blinkit's.
Why does my fill rate drop even when I ship the full quantity?
Split the causes by who actually owns the failure. It stops the blame loop.
Mostly yours (the brand):
- Slow PO acknowledgement — quantities auto-reduce before anyone looks
- Phantom stock: ERP not synced with what's physically available
- MOQ and case-size mismatches against the PO quantity
- Barcode/EAN and SKU-mapping errors that get the ASN rejected outright
- Missing the appointment slot
- Dispatching stock too close to expiry
Mostly the platform's:
- POs raised faster than warehouse-to-dark-store replenishment can physically respond
- City-level demand spikes creating POs no lead time can serve
- PO formats varying by platform and by distribution centre
- Limited or gated vendor APIs forcing manual handling
- QC and GRN judgement calls at the dock
- Short-notice appointment rescheduling
Genuinely shared — and almost nobody writes about this one: the FSSAI rule that e-commerce and quick-commerce food products must have at least 30% of shelf life OR 45 days remaining AT THE TIME OF DELIVERY. The directive was issued on 13 November 2024 and announced at a meeting with 200+ e-commerce food business operators (reported by NewsOnAir / Prasar Bharati).
Read that clause carefully: the clock runs to the customer's doorstep, not to the dark-store gate. So a dark store will legitimately refuse or short-receive stock that is comfortably in-date at dispatch. Your ERP records a full dispatch. The platform records a fill-rate miss. Neither party is wrong — it's a regulatory constraint both sides have to plan around, and it is invisible in every report built on dispatch data.
The fix for the "brand-owned" half is mostly inventory hygiene — the same discipline covered in our guide to AI inventory management for Indian MSMEs, where phantom stock is the recurring villain.
Can I see true fill rate per city or per dark store in the Blinkit seller portal?
Not in the assembled, cross-platform form you actually need — and this is where most brands stall.
The honest metric isn't hard to understand. It's hard to assemble. The correct denominator (original PO quantity, per store, per SKU) sits across three portals in three different formats. Vendor APIs from Blinkit, Zepto and Instamart are limited or gated (per Fynd's quick-commerce order-management documentation and Syphoon), PO formats vary by platform and by distribution centre, and most brands still receive POs as email attachments or portal downloads. There's a whole third-party scraping and data industry — Actowiz, FoodDataScrape and others — selling pincode-level quick-commerce data precisely because the official pipes are thin.
Then there's SKU mapping. Every platform uses its own internal article codes. Before you can compute a single cross-platform fill rate, you need a mapping master from platform article code + EAN → your internal SKU. Skip it and you're adding up numbers that don't refer to the same product.
Platforms know this data is the valuable asset. Zepto launched Zepto Atom on 16 May 2025 — a paid brand-analytics subscription selling PIN-code-level market share and minute-level refreshes, into what Zepto sized as a roughly ₹1,000 Cr Indian consumer-analytics market (Social Samosa, MediaNama, May 2025). Note the shape of that: brands are being invited to rent visibility into their own operational performance, one platform at a time. (Widely-quoted monthly price points for Atom are agency commentary, not confirmed by Zepto — treat them with caution.)
An illustrative example of how this hides
Consider a composite scenario — not a client, just the pattern we keep seeing. A Pune-based D2C snacks brand doing roasted makhana and baked namkeen, around ₹9 Cr annual revenue, with about 20% coming from quick commerce (inside the 10–25% range Forbes India reports for scaled Indian D2C brands, citing Redseer founder Anil Kumar). Fourteen SKUs, three platforms, six cities.
Its ops lead reports fill rate weekly from a spreadsheet built off the brand's own ERP: dispatched ÷ units on its own sales order. The number reads 94%, and has for months.
What the spreadsheet cannot see: POs arriving as portal downloads in three formats, partially accepted before anyone reconciles against the original PO quantity, and at the Bengaluru and Hyderabad dark stores a mix of short supply, missed appointment slots and GRN short-receipts under the FSSAI shelf-life rule quietly eating the difference. Every unit lost before dispatch is invisible by construction.
How to build a fill-rate number you actually own
The goal is one dashboard that measures every stage against the original PO quantity:
PO raised → PO accepted → Dispatched (ASN) → Received at GRN
Four checkpoints, per city, per dark store, per SKU. The gap between stage 1 and stage 2 is your acceptance leak. Between 3 and 4 is your GRN leak. Most brands can only see stage 3 to stage 4, which is exactly the 95.6% that hides the 86%.
This is the kind of plumbing Cybiqon builds for D2C brands: web scraping and API integration to auto-consolidate POs across Blinkit, Zepto and Instamart, a mapping layer from each platform's article codes to your real SKUs, and stage-by-stage measurement against the ORIGINAL PO — so you own the number instead of renting a partial view from three portals. It's the same reconciliation discipline behind Amazon and Flipkart seller reconciliation software, applied to purchase orders rather than settlements.
And it belongs to the same family of operational metrics that quietly decide whether a D2C brand is profitable — the effort you'd put into reducing your RTO rate in Indian ecommerce is the effort fill rate deserves too. Both are numbers that look fine on a dashboard right up until they've eaten your margin.
FAQs
What is fill rate on Blinkit?
Fill rate on Blinkit is the percentage of units on Blinkit's purchase order that your brand actually delivers and gets received at the dark store's GRN. Since Blinkit's shift to a first-party inventory-led model — nearly 90% of NOV on its own inventory as of the December 2025 quarter, per Eternal's Q3 FY26 shareholder letter — it functions as a wholesale vendor-compliance metric rather than a shelf-availability one.
How is fill rate calculated on Blinkit — what is the exact formula?
True fill rate = (units received at GRN ÷ units on the original PO) × 100. Example: a 500-unit PO where you accept 450, dispatch 450, and 430 are received gives 430 ÷ 500 = 86% — not the 95.6% your own sales-order-based report will show.
What is the difference between PO fill rate and SO fill rate?
PO fill rate measures against the platform's original purchase-order quantity; SO fill rate measures against your own sales order after you've trimmed it to available stock. The platform scores you on the first. The gap between them — often 8–10 percentage points — is invisible in any report built off your ERP alone.
Does Blinkit really demote your listing below 80% fill rate?
There is no primary source for this claim — no Blinkit documentation, seller agreement or filing states an 80% threshold or a demotion rule. What brands actually observe is that platforms respond to weak fill rate by quietly reducing PO size and frequency rather than sending any notification, which is why the problem usually gets misread as soft demand.
How often should a brand check its quick-commerce fill rate?
Weekly at minimum, broken down per city and per dark store, with the original PO quantity logged the day it arrives. Because PO acknowledgement windows are reported to be as tight as 60–90 minutes before quantities auto-reduce, the true denominator is unrecoverable if you don't capture it in near-real time.
Want a fill-rate dashboard you actually own?
Cybiqon AI Solutions builds websites, apps and AI automation for Indian MSMEs and D2C brands — including quick-commerce operations tooling like the PO-to-GRN fill-rate dashboard described above. If you're selling on Blinkit, Zepto or Instamart and your fill-rate number comes out of a spreadsheet nobody fully trusts, that's a solvable engineering problem, not a permanent condition.
We're a small Indian team, we work in plain language, and we'll tell you honestly if you don't need what we build. Have a look at what we do at cybiqon.in, or just reach out — +91 9250711473 or [email protected] — and describe your setup. We'll tell you what the number should look like and what it would take to get there.
Conclusion
The true fill rate in Blinkit is a simple formula — units received at GRN ÷ units on the original PO — attached to a hard data problem. Get the denominator right, name which of the five fill-rate types you're quoting, break it down per city and per dark store, and account for the FSSAI shelf-life rule before you blame your logistics partner. Do that and you'll spot a shrinking PO for what it is: a supply signal, weeks before it looks like weak demand. If you'd like help assembling it, Cybiqon is a message away.
Want this set up for your business?
Book a free call — no tech jargon, no sales pressure. Just honest answers.